Bresenham's Circle Drawing Algorithm
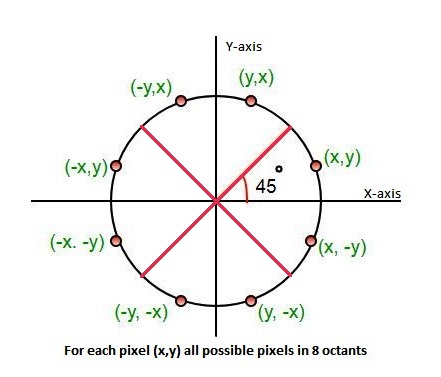
As per Eight way symmetry property of circle, circle can be divided into 8 octants each of 45-degrees.
The Algorithm calculate the location of pixels in the first octant of 45 degrees and extends it to the other 7 octants. For every pixel (x, y), the algorithm draw a pixel in each of the 8 octants of the circle as shown below :
Assumption : Center of Cirle is Origin.
Following image illustrates the 8 octants with corresponding pixel:
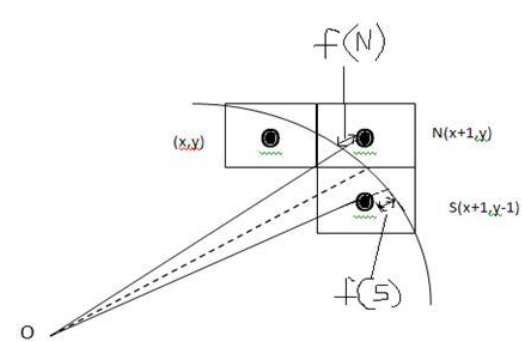
 Point (x, y) is in the first octant and is on the circle.
To calculate the next pixel location, can be either:
 It is decided by using the decision parameter d as:
Library used: p5.js
Web Editor: https://editor.p5js.org
Output Screenshots:
Code:
// initial values
let x, y, r, d, xc, yc;
let i = 0;
let grids = 26;
let scalFact;
function setup() {
createCanvas(600, 600);
background(0);
scalFact = width / grids;
r = 3 * scalFact;
xc = 15 * scalFact;
yc = 8 * scalFact;
showGrids();
showRefCircle();
bresenham();
}
function showGrids() {
stroke(255);
for (i; i < grids * scalFact; i += scalFact) {
line(i, 0, i, height);
line(0, i, width, i);
}
}
function showRefCircle() {
stroke(200);
noFill();
circle(xc + (scalFact / 2), yc + (scalFact / 2), r * 2);
}
function bresenham() {
x = 0;
y = r;
d = (3 * scalFact) - (2 * r);
symPlot();
while (x <= y) {
if (d <= 0) {
d = d + (4 * x) + (6 * scalFact);
} else {
d = d + (4 * x) - (4 * y) + (10 * scalFact);
y -= scalFact;
}
x += scalFact;
symPlot();
}
}
function symPlot() {
fillPixel(x + xc, y + yc);
fillPixel(x + xc, -y + yc);
fillPixel(-x + xc, -y + yc);
fillPixel(-x + xc, y + yc);
fillPixel(y + xc, x + yc);
fillPixel(y + xc, -x + yc);
fillPixel(-y + xc, -x + yc);
fillPixel(-y + xc, x + yc);
}
function fillPixel(x, y) {
noStroke();
squareColor = color(255, 255, 255);
squareColor.setAlpha(100);
fill(squareColor);
square(x, y, scalFact);
}
As per Eight way symmetry property of circle, circle can be divided into 8 octants each of 45-degrees.
The Algorithm calculate the location of pixels in the first octant of 45 degrees and extends it to the other 7 octants. For every pixel (x, y), the algorithm draw a pixel in each of the 8 octants of the circle as shown below :
Assumption : Center of Cirle is Origin.
Following image illustrates the 8 octants with corresponding pixel:
 Point (x, y) is in the first octant and is on the circle.
To calculate the next pixel location, can be either:
- N (x+1, y)
- S (x+1, y-1)
 It is decided by using the decision parameter d as:
- If d <= 0, then N(x+1, y) is to be chosen as next pixel.
- If d > 0, then S(x+1, y-1) is to be chosen as the next pixel.
Library used: p5.js
Web Editor: https://editor.p5js.org
Output Screenshots:
Code:
// initial values
let x, y, r, d, xc, yc;
let i = 0;
let grids = 26;
let scalFact;
function setup() {
createCanvas(600, 600);
background(0);
scalFact = width / grids;
r = 3 * scalFact;
xc = 15 * scalFact;
yc = 8 * scalFact;
showGrids();
showRefCircle();
bresenham();
}
function showGrids() {
stroke(255);
for (i; i < grids * scalFact; i += scalFact) {
line(i, 0, i, height);
line(0, i, width, i);
}
}
function showRefCircle() {
stroke(200);
noFill();
circle(xc + (scalFact / 2), yc + (scalFact / 2), r * 2);
}
function bresenham() {
x = 0;
y = r;
d = (3 * scalFact) - (2 * r);
symPlot();
while (x <= y) {
if (d <= 0) {
d = d + (4 * x) + (6 * scalFact);
} else {
d = d + (4 * x) - (4 * y) + (10 * scalFact);
y -= scalFact;
}
x += scalFact;
symPlot();
}
}
function symPlot() {
fillPixel(x + xc, y + yc);
fillPixel(x + xc, -y + yc);
fillPixel(-x + xc, -y + yc);
fillPixel(-x + xc, y + yc);
fillPixel(y + xc, x + yc);
fillPixel(y + xc, -x + yc);
fillPixel(-y + xc, -x + yc);
fillPixel(-y + xc, x + yc);
}
function fillPixel(x, y) {
noStroke();
squareColor = color(255, 255, 255);
squareColor.setAlpha(100);
fill(squareColor);
square(x, y, scalFact);
}


No comments:
Post a Comment