Sunday, November 3, 2019

Bezier Cirves

Bezier Curves

A bezier curve is defined by control points.
There may be 2, 3, 4 or more.
For instance, two points curve:
Three points curve:
Four points curve:
If you look closely at these curves, you can immediately notice:
  1. Points are not always on curve. That’s perfectly normal, later we’ll see how the curve is built.
  2. The curve order equals the number of points minus one. For two points we have a linear curve (that’s a straight line), for three points – quadratic curve (parabolic), for four points – cubic curve.
  3. A curve is always inside the convex hull of control points:

Because of that last property, in computer graphics it’s possible to optimize intersection tests. If convex hulls do not intersect, then curves do not either. So checking for the convex hulls intersection first can give a very fast “no intersection” result. Checking the intersection or convex hulls is much easier, because they are rectangles, triangles and so on (see the picture above), much simpler figures than the curve.
The main value of Bezier curves for drawing – by moving the points the curve is changing in intuitively obvious way.


Output Screenshots:


Code:
function setup() {
  createCanvas(720, 400);
  stroke(255);
  noFill();
}

function draw() {
  background(0);
  for (let i = 0; i < 200; i += 20) {
    bezier(
      mouseX - i / 2.0,
      40 + i,
      410,
      20,
      440,
      300,
      240 - i / 16.0,
      300 + i / 8.0
    );
  }
}

L Systems

L System

L-systems (Lindenmayer-systems, named after Aristid Lindenmayer, 1925-1989), allow definition of complex shapes through the use of iteration. They use a mathematical language in which an initial string of characters is matched against rules which are evaluated repeatedly, and the results are used to generate geometry. The result of each evaluation becomes the basis for the next iteration of geometry, giving the illusion of growth.

 Output Screenshots:


Code:

let x, y;
let currentangle = 0;
let step = 20;
let angle = 90;

let thestring = 'A';
let numloops = 5;
let therules = [];
therules[0] = ['A', '-BF+AFA+FB-'];
therules[1] = ['B', '+AF-BFB-FA+'];

let whereinstring = 0;

function setup() {
  createCanvas(710, 400);
  background(255);
  stroke(0, 0, 0, 255);

  x = 0;
  y = height-1;

  // COMPUTE THE L-SYSTEM
  for (let i = 0; i < numloops; i++) {
    thestring = lindenmayer(thestring);
  }
}

function draw() {

 
  drawIt(thestring[whereinstring]);


  whereinstring++;
  if (whereinstring > thestring.length-1) whereinstring = 0;

}


function lindenmayer(s) {
  let outputstring = '';

 
  for (let i = 0; i < s.length; i++) {
    let ismatch = 0;
    for (let j = 0; j < therules.length; j++) {
      if (s[i] == therules[j][0])  {
        outputstring += therules[j][1];
        ismatch = 1;
        break;
      }
    }
   
    if (ismatch == 0) outputstring+= s[i];
  }

  return outputstring;
}

function drawIt(k) {

  if (k=='F') {
   
    let x1 = x + step*cos(radians(currentangle));
    let y1 = y + step*sin(radians(currentangle));
    line(x, y, x1, y1);

   
    x = x1;
    y = y1;
  } else if (k == '+') {
    currentangle += angle;
  } else if (k == '-') {
    currentangle -= angle;
  }


  let r = random(128, 255);
  let g = random(0, 192);
  let b = random(0, 50);
  let a = random(50, 100);

  let radius = 0;
  radius += random(0, 15);
  radius += random(0, 15);
  radius += random(0, 15);
  radius = radius / 3;

  fill(r, g, b, a);
  ellipse(x, y, radius, radius);
}

3D Primitives with OpenGL(DA1)


3D Primitives with OpenGL


OpenGL is mainly considered an API (an Application Programming Interface) that provides us with a large set of functions that we can use to manipulate graphics and images. However, OpenGL by itself is not an API, but merely a specification, developed and maintained by the Khronos Group.
The OpenGL specification specifies exactly what the result/output of each function should be and how it should perform. It is then up to the developers implementing this specification to come up with a solution of how this function should operate. Since the OpenGL specification does not give us implementation details, the actual developed versions of OpenGL are allowed to have different implementations, as long as their results comply with the specification (and are thus the same to the user).


Output Screenshots:


Code:
#include <GL\glut.h>
#include <stdlib.h>
#include <math.h>
#include <iostream>
using namespace std;

GLfloat xAngle, yAngle, zAngle;
GLdouble radius = 1, side = 1, b_radius = 1, height = 3, inner_radius = 1, outer_radius = 2;
int option;

void display(void);
void reshape(int x, int y);

void get_key(unsigned char key, int x, int y) {
    option = int(key) - int('0');
    switch (option) {
    case 1:
        cout << "You have chosen Sphere\nEnter radius:";
        cin >> radius;
        cout << "\n";
        break;
    case 2:
        cout << "YOu have chosen Cube\nEnter side length: ";
        cin >> side;
        cout << "\n";
        break;
    case 3:
        cout << "You have chose Cone\nEnter base radius: ";
        cin >> b_radius;
        cout << "Enter height: ";
        cin >> height;
        cout << "\n";
        break;
    case 4:
        cout << "You have chosen Torus\nEnter inner radius: ";
        cin >> inner_radius;
        cout << "Enter outer radius: ";
        cin >> outer_radius;
        cout << "\n";
        break;

    }
}
void idle(void)
{
    xAngle += 0.01;
    yAngle += 0.01;
    zAngle += 0.01;
    display();
}

int main(int argc, char** argv)
{
    glutInit(&argc, argv);
    glutInitWindowPosition(350, 350);
    glutInitWindowPosition(500, 500);
    glutCreateWindow("3D Primitives in OpenGl");
    xAngle = yAngle = zAngle = 0;
    cout << "Enter option\n1.Sphere\n2.Cube\n3.Cone\n4.Torus\n5.Dodecahedron\n6.Octahedron\n7.Tetrahedron";
    cin >> option;
    glutDisplayFunc(display);
    glutReshapeFunc(reshape);
    glutKeyboardFunc(get_key);
    glutIdleFunc(idle);
    glutMainLoop();
    return 0;
}

void display(void)
{
    //initalize
    glMatrixMode(GL_MODELVIEW);
    glClear(GL_COLOR_BUFFER_BIT);
    glLoadIdentity();

    //object depth
    glTranslatef(0.0, 0.0, -3.0);

    //changing transformation matrix
    //rotation about X aixs
    glRotatef(xAngle, 1.0, 0.0, 0.0);
    //Y axis
    glRotatef(yAngle, 0.0, 1.0, 0.0);
    //Z axis
    glRotatef(zAngle, 0.0, 0.0, 1.0);
    //scaling
    glScalef(1.0, 1.0, 1.0);
    switch (option) {
    case 1:
        glutWireSphere(radius, 10, 10);
        break;
    case 2:
        glutWireCube(side);
        break;
    case 3:
        glutWireCone(b_radius, height, 10, 10);
        break;
    case 4:
        glutWireTorus(inner_radius, outer_radius, 10, 10);
        break;
    case 5:
        glutWireDodecahedron();
        break;
    case 6:
        glutWireOctahedron();
        break;
    case 7:
        glutWireTetrahedron();
        break;
    case 0:
        cout << "Exit\n";
        return;
    }
    glFlush();
}

void reshape(int x, int y)
{
    if (y == 0 || x == 0) return;
    glMatrixMode(GL_PROJECTION);
    glLoadIdentity();
    gluPerspective(120, (GLdouble)x / (GLdouble)y, 0.6, 21.0);
    glMatrixMode(GL_MODELVIEW);
    glViewport(0, 0, x, y);
}


2-D Composite Transformation

2-D Composite Transformation

Multiple transformations that are represented by matrices multiplied and combined into one transformation matrix.

Implemented with a JavaScript library - p5.js.
- Offers 4 different types of transformations - rotation, x translate, y translate and scaling
- Interactive sliders and buttons to set values for transformations

Output Screenshots:

Initial Position:


 Rotation:
 Translation:
 Scaling:

Code:
let scaleSlider, xTranslateSlider, yTranslateSlider, rotateSlider, transButton, resetButton;
let scal = 0,
  yTrans = 0,
  xTrans = 0,
  rot = 0;
let polySize = 4;
let x1 = 0,
  y1 = 0,
  x2 = 80,
  y2 = 0,
  x3 = 80,
  y3 = 80,
  x4 = 0,
  y4 = 80;
let vert = [];
let vertCopy = [];


function setup() {
  createCanvas(600, 600);

  scaleSlider = createSlider(1.0, 5.0, 1.0);
  scaleSlider.position(20, height - (scaleSlider.height * 1.5));

  yTranslateSlider = createSlider(0, height, 0);
  yTranslateSlider.position(20, height - (yTranslateSlider.height * 3));

  xTranslateSlider = createSlider(0, width, 0);
  xTranslateSlider.position(20, height - (xTranslateSlider.height * 4.5));

  rotateSlider = createSlider(0, 2 * PI, 0);
  rotateSlider.position(20, height - (rotateSlider.height * 6));

  transButton = createButton('Transform!');
  transButton.position(width - 160, height - 40);

  resetButton = createButton('Reset');
  resetButton.position(width - 70, height - 40);

  vert = [
    [x1, y1, 1],
    [x2, y2, 1],
    [x3, y3, 1],
    [x4, y4, 1]
  ];

  for(let i = 0; i < polySize; i++) {
    vertCopy[i] = [];
    vertCopy[i][0] = vert[i][0];
    vertCopy[i][1] = vert[i][1];
    vertCopy[i][2] = vert[i][2];
  }

}

function draw() {
  background(20, 81, 181);
  noStroke();
  fill(255);

  scal = scaleSlider.value();
  yTrans = yTranslateSlider.value();
  xTrans = xTranslateSlider.value();
  rot = rotateSlider.value();

  strokeWeight(1);
  text('Scale:', scaleSlider.x * 2 + scaleSlider.width, height - scaleSlider.height);
  text(scal, 250, height - scaleSlider.height);

  text('Y Translate:', yTranslateSlider.x * 2 + yTranslateSlider.width, height - yTranslateSlider.height * 2.5);
  text(yTrans, 250, height - yTranslateSlider.height * 2.5);

  text('X Translate:', xTranslateSlider.x * 2 + xTranslateSlider.width, height - xTranslateSlider.height * 4);
  text(xTrans, 250, height - xTranslateSlider.height * 4);

  text('Rotate:', rotateSlider.x * 2 + rotateSlider.width, height - rotateSlider.height * 5.5);
  text(rot, 250, height - rotateSlider.height * 5.5);

  transButton.mousePressed(transform);
  resetButton.mousePressed(reset);
  drawPoly();
}

function transform() {
  let transMat = math.matrix([[1, 0, xTrans], [0, 1, yTrans], [0, 0, 1]]);
  let rotMat = math.matrix([[cos(rot), -sin(rot), 0], [sin(rot), cos(rot), 0], [0, 0, 1]]);
  let scalMat = math.matrix([[scal, 0, 0], [0, scal, 0], [0, 0, 1]]);

  let vertTranspose = math.transpose(vert);

  let interMat = math.multiply(scalMat, rotMat);
  interMat = math.multiply(transMat, interMat);

  let finalMat = math.multiply(interMat, vertTranspose);
  finalMat = math.transpose(finalMat)
  vert = finalMat._data;
}

function reset() {
  vert = vertCopy;


function drawPoly() {
  stroke(255, 60, 60);
  strokeWeight(3);
  for (let i = 0; i < polySize; i++) {
    let k = (i + 1) % polySize;
    line(vert[i][0], vert[i][1], vert[k][0], vert[k][1]);
  }

Polygon Clipping Sutherland Hodgman Algorithm


Polygon Clipping Sutherland Hodgman Algorithm

A polygon can be clipped by processing its boundary as a whole against each window edge. This is achieved by processing all polygon vertices against each clip rectangle boundary in turn. beginning with the original set of polygon vertices, we could first clip the polygon against the left rectangle boundary to produce a new sequence of vertices. The new set of vertices could then be successively passed to a right boundary clipper, a top boundary clipper and a bottom boundary clipper. At each step a new set of polygon vertices is generated and passed to the next window boundary clipper. This is the fundamental idea used in the Sutherland - Hodgeman algorithm.


Sutherland-Hodgeman Polygon Clipping Algorithm:-
  1. Read coordinates of all vertices of the Polygon.
  2. Read coordinates of the dipping window
  3. Consider the left edge of the window
  4. Compare the vertices of each edge of the polygon, individually with the clipping plane.
  5. Save the resulting intersections and vertices in the new list of vertices according to four possible relationships between the edge and the clipping boundary.
  6. Repeat the steps 4 and 5 for remaining edges or the clipping window. Each time the resultant list of vertices is successively passed to process the next edge of the clipping window.
  7. Stop. 


Output Screenshots:


Code:

sketch.js:
function setup() {
  createCanvas(600, 600);
}

function draw() {
  background(255);

  let window = new Window();
  window.display();

  let poly = new Polygon();
  poly.refDisp();

  strokeWeight(5)
  stroke(0, 100, 100);
  sutherClip(poly.vertices, poly.vertices.length, window.vertices,
    window.vertices.length);


}

function xIntersect(x1, y1, x2, y2, x3, y3, x4, y4) {
  let nr = (x1 * y2 - y1 * x2) * (x3 - x4) - (x1 - x2) *
    (x3 * y4 - y3 * x4);
  let dr = (x1 - x2) * (y3 - y4) - (y1 - y2) * (x3 - x4);

  return nr / dr;
}

function yIntersect(x1, y1, x2, y2, x3, y3, x4, y4) {
  let nr = (x1 * y2 - y1 * x2) * (y3 - y4) -
    (y1 - y2) * (x3 * y4 - y3 * x4);
  let dr = (x1 - x2) * (y3 - y4) - (y1 - y2) * (x3 - x4);

  return nr / dr;
}

// clipping wrt one clip edge
function clip(polyVert, polySize, x1, y1, x2, y2) {
  let newVert = [];
  let newPolSize = 0;

  for (let i = 0; i < polySize; i++) {
    let k = (i + 1) % polySize;
    let ix = polyVert[i][0];
    let iy = polyVert[i][1];
    let kx = polyVert[k][0];
    let ky = polyVert[k][1];

    // calculating position of first point wrt clipper line
    let iPos = (x2 - x1) * (iy - y1) - (y2 - y1) * (ix - x1);

    // calculating position of second point wrt clipper line
    let kPos = (x2 - x1) * (ky - y1) - (y2 - y1) * (kx - x1);

    // when both points are inside
    if (iPos > 0 && kPos > 0) {
      newVert[newPolSize] = [];
      newVert[newPolSize][0] = kx;
      newVert[newPolSize][1] = ky;
      newPolSize++;
    }

    // when only first point is outside
    else if (iPos <= 0 && kPos > 0) {
      newVert[newPolSize] = [];
      newVert[newPolSize][0] = xIntersect(x1, y1, x2, y2, ix, iy, kx, ky);
      newVert[newPolSize][1] = yIntersect(x1, y1, x2, y2, ix, iy, kx, ky);
      newPolSize++;

      newVert[newPolSize] = [];
      newVert[newPolSize][0] = kx;
      newVert[newPolSize][1] = ky;
      newPolSize++;
    }

    // when only second point is outside
    else if (iPos > 0 && kPos <= 0) {
      newVert[newPolSize] = [];
      newVert[newPolSize][0] = xIntersect(x1,
        y1, x2, y2, ix, iy, kx, ky);
      newVert[newPolSize][1] = yIntersect(x1,
        y1, x2, y2, ix, iy, kx, ky);
      newPolSize++;
    }

    // when both points are outside
    else {}
  }

  // copying new points into original array
  polySize = newPolSize;
  for (let i = 0; i < polySize; i++) {
    polyVert[i] = [];
    polyVert[i][0] = newVert[i][0];
    polyVert[i][1] = newVert[i][1];
  }
}

function sutherClip(polyVert, polySize, windowVert, windowSize) {
  for (let i = 0; i < windowSize; i++) {
    let k = (i + 1) % windowSize;

    clip(polyVert, polySize, windowVert[i][0],
      windowVert[i][1], windowVert[k][0],
      windowVert[k][1]);
  }

  for (let i = 0; i < polySize; i++)
    print(polyVert[i][0], polyVert[i][1]);

  dispClip(polyVert);
}

function dispClip(finalPolyVert) {
  for (let i = 0; i < finalPolyVert.length; i++) {
    let k = (i + 1) % finalPolyVert.length;
    line(finalPolyVert[i][0], finalPolyVert[i][1],
      finalPolyVert[k][0], finalPolyVert[k][1]);
  }
}

window.js:
class Window {
  constructor() {
    this.width = 300;
    this.height = 250;
    this.x = mouseX - (this.width / 2);
    this.y = mouseY - (this.height / 2);
    this.vertices = [[this.x, this.y], [this.x + this.width,
                     this.y], [this.x + this.width, this.y +
                     this.height], [this.x, this.y + this.height]];
  }

  display() {
    stroke(0);
    strokeWeight(1);
    noFill();
    rect(this.x, this.y, this.width, this.height);
  }


polygon.js
class Polygon {
  constructor() {
    this.vertices = [[200, 250], [300, 350], [400, 300]];
  }

  refDisp() {
    stroke(0);
    strokeWeight(1);
    for(let i = 0; i < this.vertices.length - 1; i++) {
      line(this.vertices[i][0], this.vertices[i][1],
           this.vertices[i + 1][0], this.vertices[i + 1][1]);
    }
    line(this.vertices[this.vertices.length - 1][0],
         this.vertices[this.vertices.length - 1][1],
          this.vertices[0][0], this.vertices[0][1]);
  }

Bresenham's Circle Drawing Algorithm

Bresenham's Circle Drawing Algorithm

As per Eight way symmetry property of circle, circle can be divided into 8 octants each of 45-degrees.
The Algorithm calculate the location of pixels in the first octant of 45 degrees and extends it to the other 7 octants. For every pixel (x, y), the algorithm draw a pixel in each of the 8 octants of the circle as shown below :
Assumption : Center of Cirle is Origin.
Following image illustrates the 8 octants with corresponding pixel:
Bresenham’s Circle Drawing. 
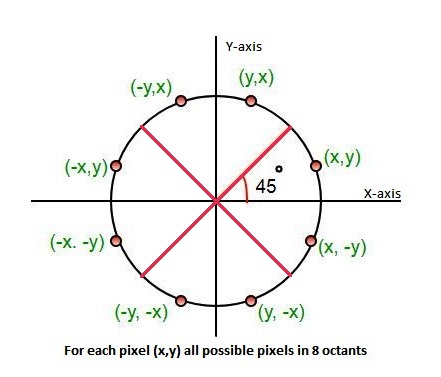
Point (x, y) is in the first octant and is on the circle.
To calculate the next pixel location, can be either:
  • N (x+1, y)
  • S (x+1, y-1)
Bresenham’s Circle Drawing. 
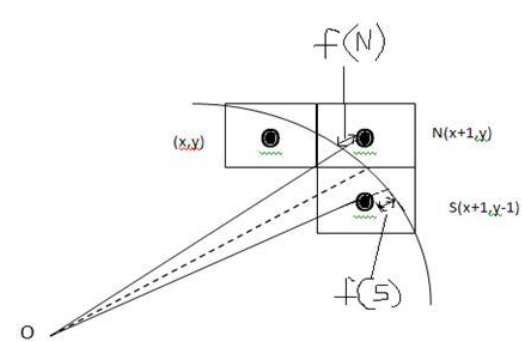
It is decided by using the decision parameter d as:
  • If d <= 0, then N(x+1, y) is to be chosen as next pixel.
  • If d > 0, then S(x+1, y-1) is to be chosen as the next pixel.

Library used: p5.js

Web Editor: https://editor.p5js.org


 Output Screenshots:


 Code:

// initial values
let x, y, r, d, xc, yc;

let i = 0;
let grids = 26;
let scalFact;

function setup() {
  createCanvas(600, 600);
  background(0);

  scalFact = width / grids;
  r = 3 * scalFact;

  xc = 15 * scalFact;
  yc = 8 * scalFact;

  showGrids();
  showRefCircle();
  bresenham();
}

function showGrids() {
  stroke(255);
  for (i; i < grids * scalFact; i += scalFact) {
    line(i, 0, i, height);
    line(0, i, width, i);
  }
}

function showRefCircle() {
  stroke(200);
  noFill();
  circle(xc + (scalFact / 2), yc + (scalFact / 2), r * 2);
}

function bresenham() {
  x = 0;
  y = r;

  d = (3 * scalFact) - (2 * r);

  symPlot();
  while (x <= y) {
    if (d <= 0) {
      d = d + (4 * x) + (6 * scalFact);
    } else {
      d = d + (4 * x) - (4 * y) + (10 * scalFact);
      y -= scalFact;
    }

    x += scalFact;
    symPlot();
  }
}

function symPlot() {
  fillPixel(x + xc, y + yc);
  fillPixel(x + xc, -y + yc);
  fillPixel(-x + xc, -y + yc);
  fillPixel(-x + xc, y + yc);
  fillPixel(y + xc, x + yc);
  fillPixel(y + xc, -x + yc);
  fillPixel(-y + xc, -x + yc);
  fillPixel(-y + xc, x + yc);
}

function fillPixel(x, y) {
  noStroke();
  squareColor = color(255, 255, 255);
  squareColor.setAlpha(100);
  fill(squareColor);
  square(x, y, scalFact);
}

Bresenham's Line Drawing Algorithm


Bresenham's Line Drawing Algorithm


Bresenham's line algorithm is a line drawing algorithm that determines the points of an n-dimensional raster that should be selected in order to form a close approximation to a straight line between two points. It is commonly used to draw line primitives in a bitmap image (e.g. on a computer screen), as it uses only integer addition, subtraction and bit shifting, all of which are very cheap operations in standard computer architectures. It is an incremental error algorithm. It is one of the earliest algorithms developed in the field of computer graphics. An extension to the original algorithm may be used for drawing circles.


Below is an implementation of Bresenham's Line Drawing Algorithm.


Library used: p5.js

Web Editor: https://editor.p5js.org


Output Screenshots:


Code:
var numCol;
var numRow;
var xStart, yStart, xEnd, yEnd;
var x1, x2, y1, y2;
x1 = 2;
y1 = 1;
x2 = 7;
y2 = 3;

//drawing

xStart = x1, yStart = y1;
xEnd = x1, yEnd = y1;

function setup() {
  createCanvas(500, 500);
  background(0);

  numCol = 10;
  numRow = 10;
  unitX = width / numCol;
  unitY = height / numRow;

  //initializing the drawing
  xStart *= unitX;
  yStart *= unitY;
  xEnd *= unitX;
  yEnd *= unitY;

  while (xStart < x2 * unitX) {
    refPointX = xStart + unitX;
    refPointY = yStart + (0.5 * unitY);
    refPointPos = checkSign(refPointX, refPointY);
    console.log(refPointX, refPointY);
    console.log(refPointPos);

    if (refPointPos < 0) {
      //East
      xEnd += unitX;
      stroke(255);
      strokeWeight(5);
      line(xStart, yStart, xEnd, yEnd);
      xStart += unitX;
      yEnd += unitY;
      line(xStart, yStart, xEnd, yEnd);
      yStart = yEnd;
    } else {
      //SouthEast
      stroke(255);
      strokeWeight(5);
      xEnd += unitX;
      line(xStart, yStart, xEnd, yEnd);
      xStart = xEnd;
    }
  }
}

function draw() {
  stroke(25);
  drawGrid();
  drawRefLine();
}

function drawGrid() {
  strokeWeight(1);
  for (var i = 1; i < numCol; i++) {
    line(unitX * i, 0, unitX * i, height);
    line(0, unitY * i, width, unitY * i);
  }
}

function drawRefLine() {
  strokeWeight(1);
  stroke(180);
  line(x1 * unitX, y1 * unitY, x2 * unitX, y2 * unitY);
}

function checkSign(x, y) {
  m = (y2 - y1) / (x2 - x1);
  c = y1 - (m * x1);
  c *= unitX;
  f = y - (m * x) - c;
  return f;
}